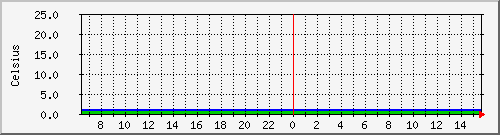
| Max Inside | 1 °C | Average Inside | 1 °C | Current Inside | 1 °C | ||
| Max Output | 1 °C | Average Output | 1 °C | Current Output | 1 °C |
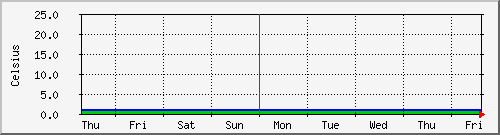
| Max Inside | 1 °C | Average Inside | 1 °C | Current Inside | 1 °C | ||
| Max Output | 1 °C | Average Output | 1 °C | Current Output | 1 °C |
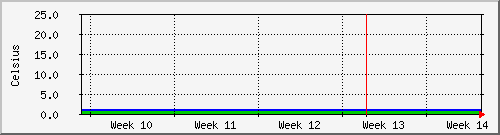
| Max Inside | 1 °C | Average Inside | 1 °C | Current Inside | 1 °C | ||
| Max Output | 1 °C | Average Output | 1 °C | Current Output | 1 °C |
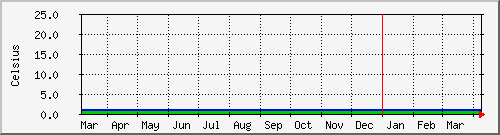
| Max Inside | 1 °C | Average Inside | 1 °C | Current Inside | 1 °C | ||
| Max Output | 1 °C | Average Output | 1 °C | Current Output | 1 °C |
| GREEN ### | Temperature |
| BLUE ### | Outgoing Traffic in Bytes per Second |
| DARK GREEN### | Maximal 5 Minute Incoming Traffic |
| MAGENTA### | Maximal 5 Minute Outgoing Traffic |
| 2.10.15 | Tobias Oetiker <oetiker@ee.ethz.ch> and Dave Rand <dlr@bungi.com> |